Autopsy: the 3 November 2026 general election against the forecast
Loading the autopsy…
The race for governor
The legislature
Every office against its published forecast
| office | result: Democrat | result: Republican | result margin | published: Democrat | published margin and range | the Democrat against the forecast | inside the range? | ticket lag: the Republican against the governor | the same gap in 2022 / 2018 |
|---|
The maps: every race, the split fill, the best Democrat, the county pies and turnout by party
Map
RaceShow
View by
Values by
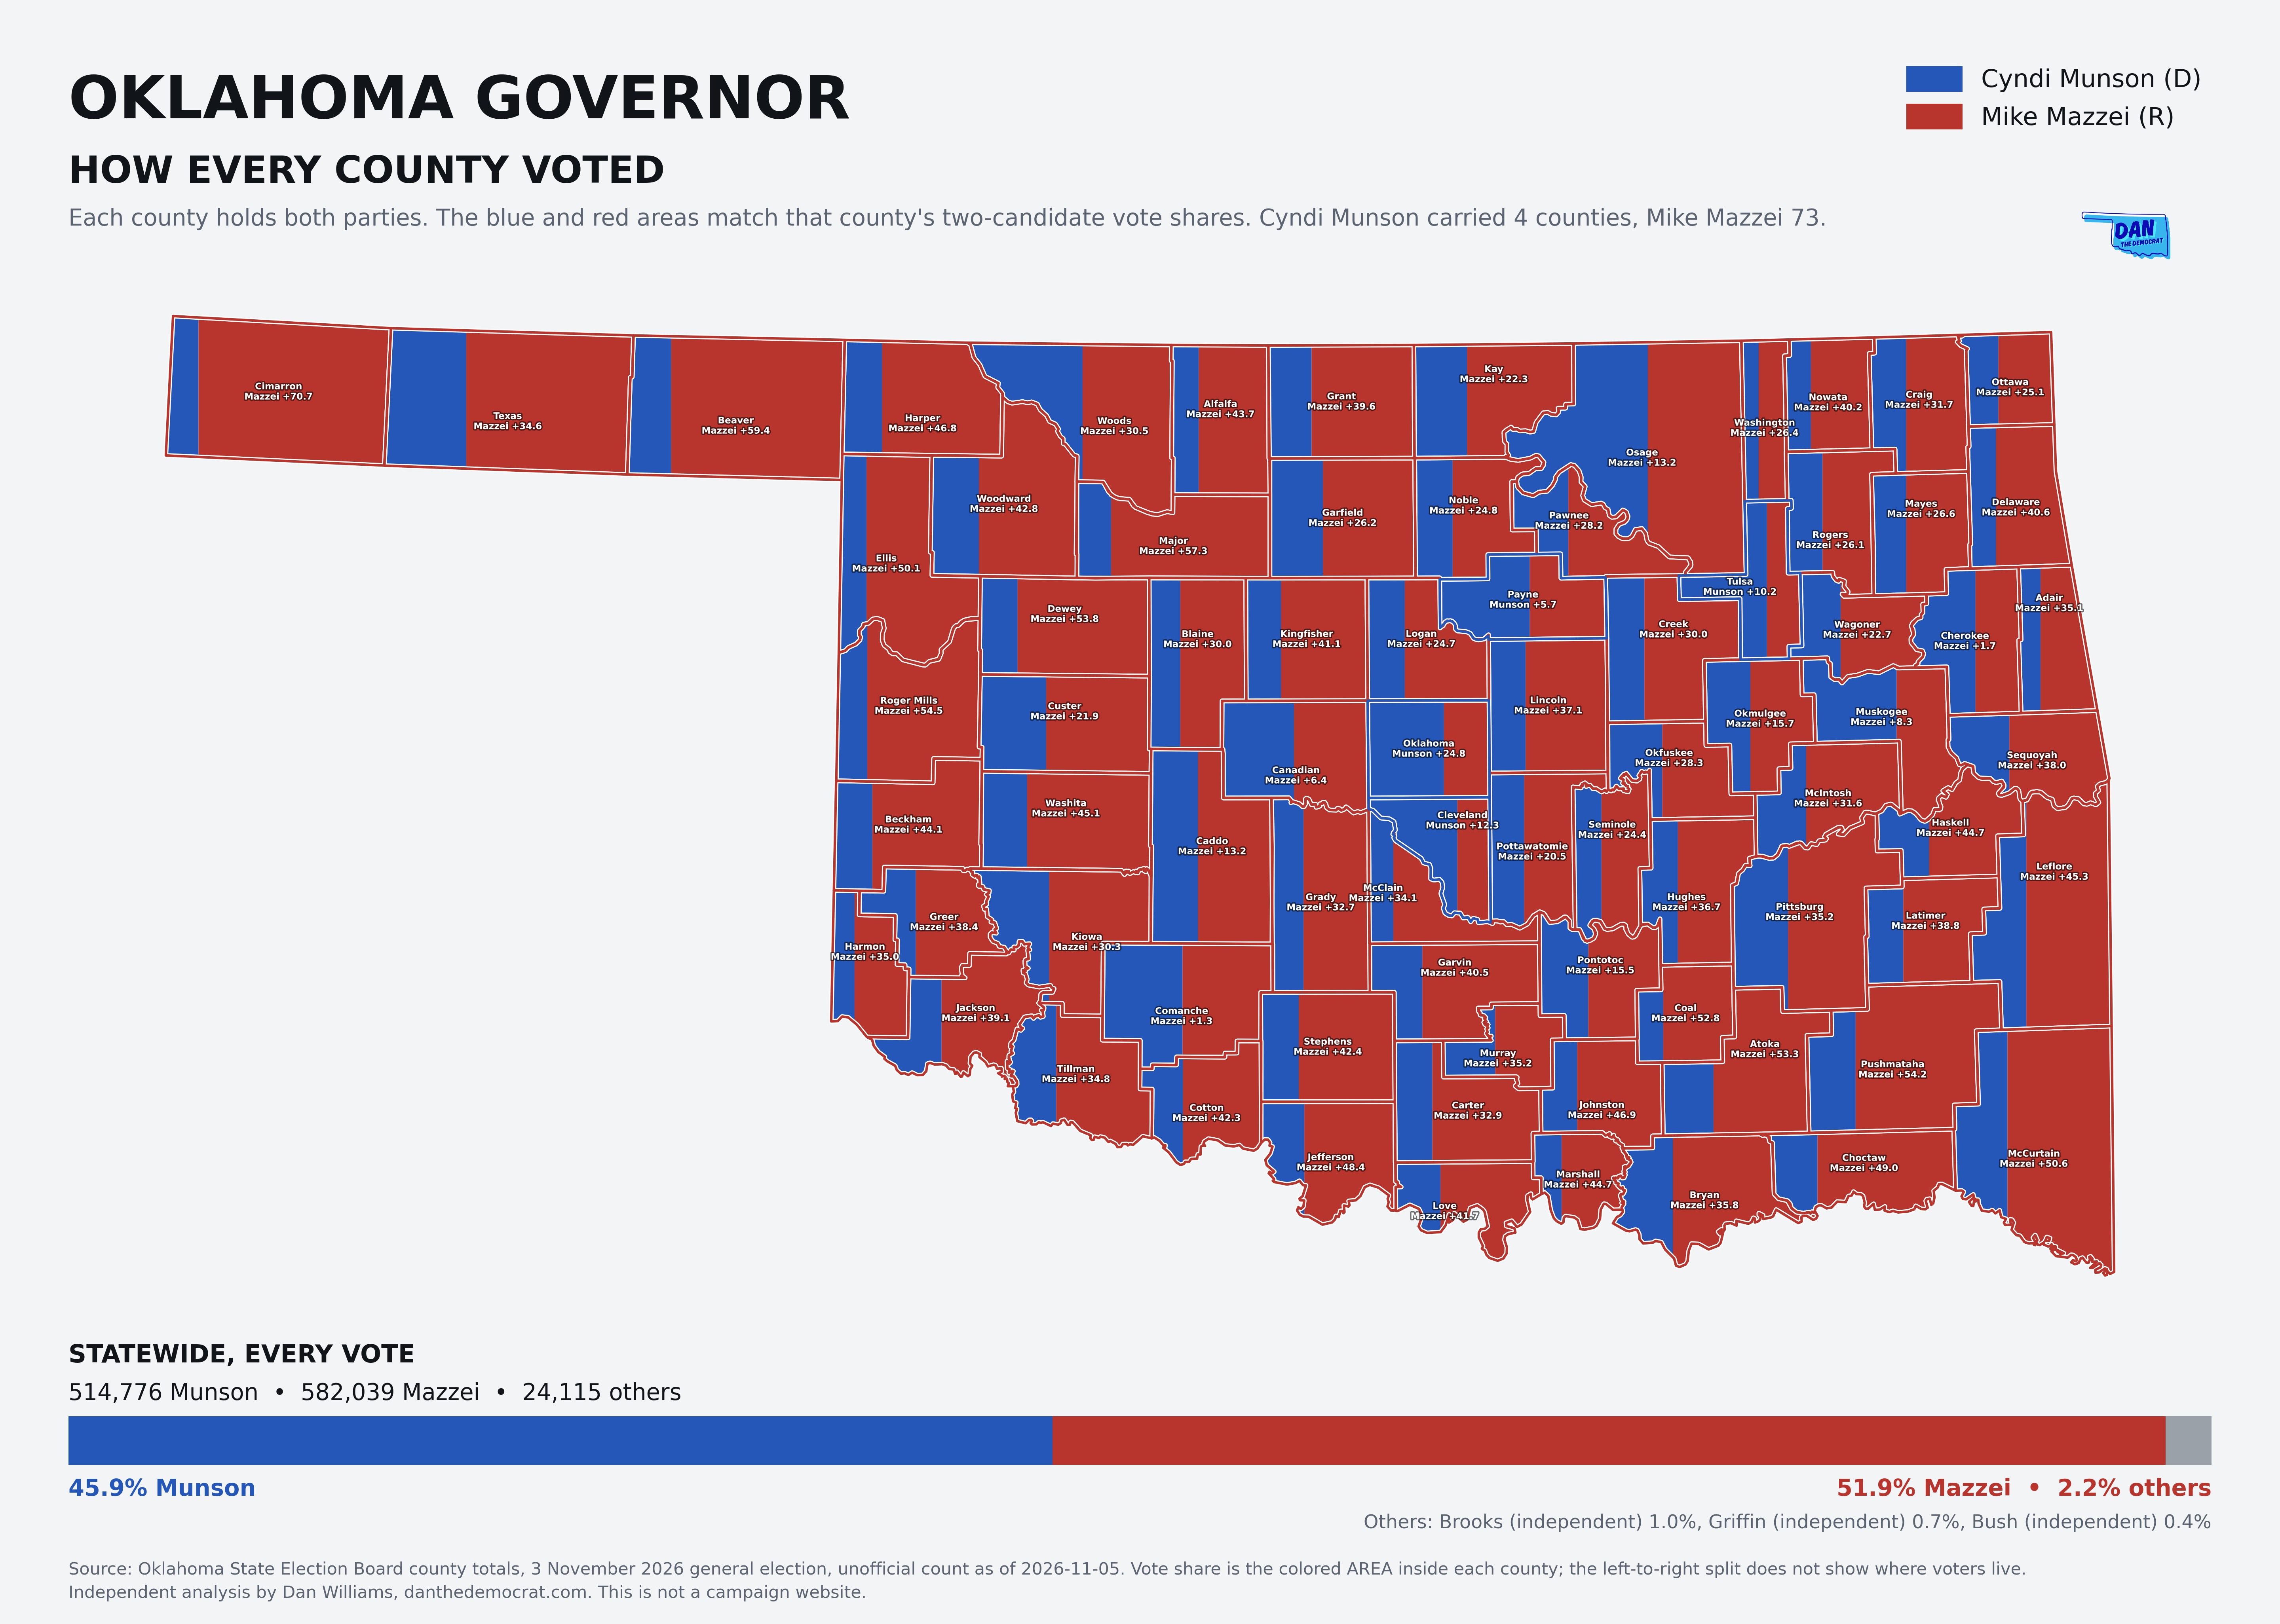
How every county voted, and every precinct: who won, and who voted
FillShapesHover or tap a shape for its votes. Scroll to zoom, drag to move.
The still images (PNG): who won, by county, light and dark; who voted, by precinct and by county
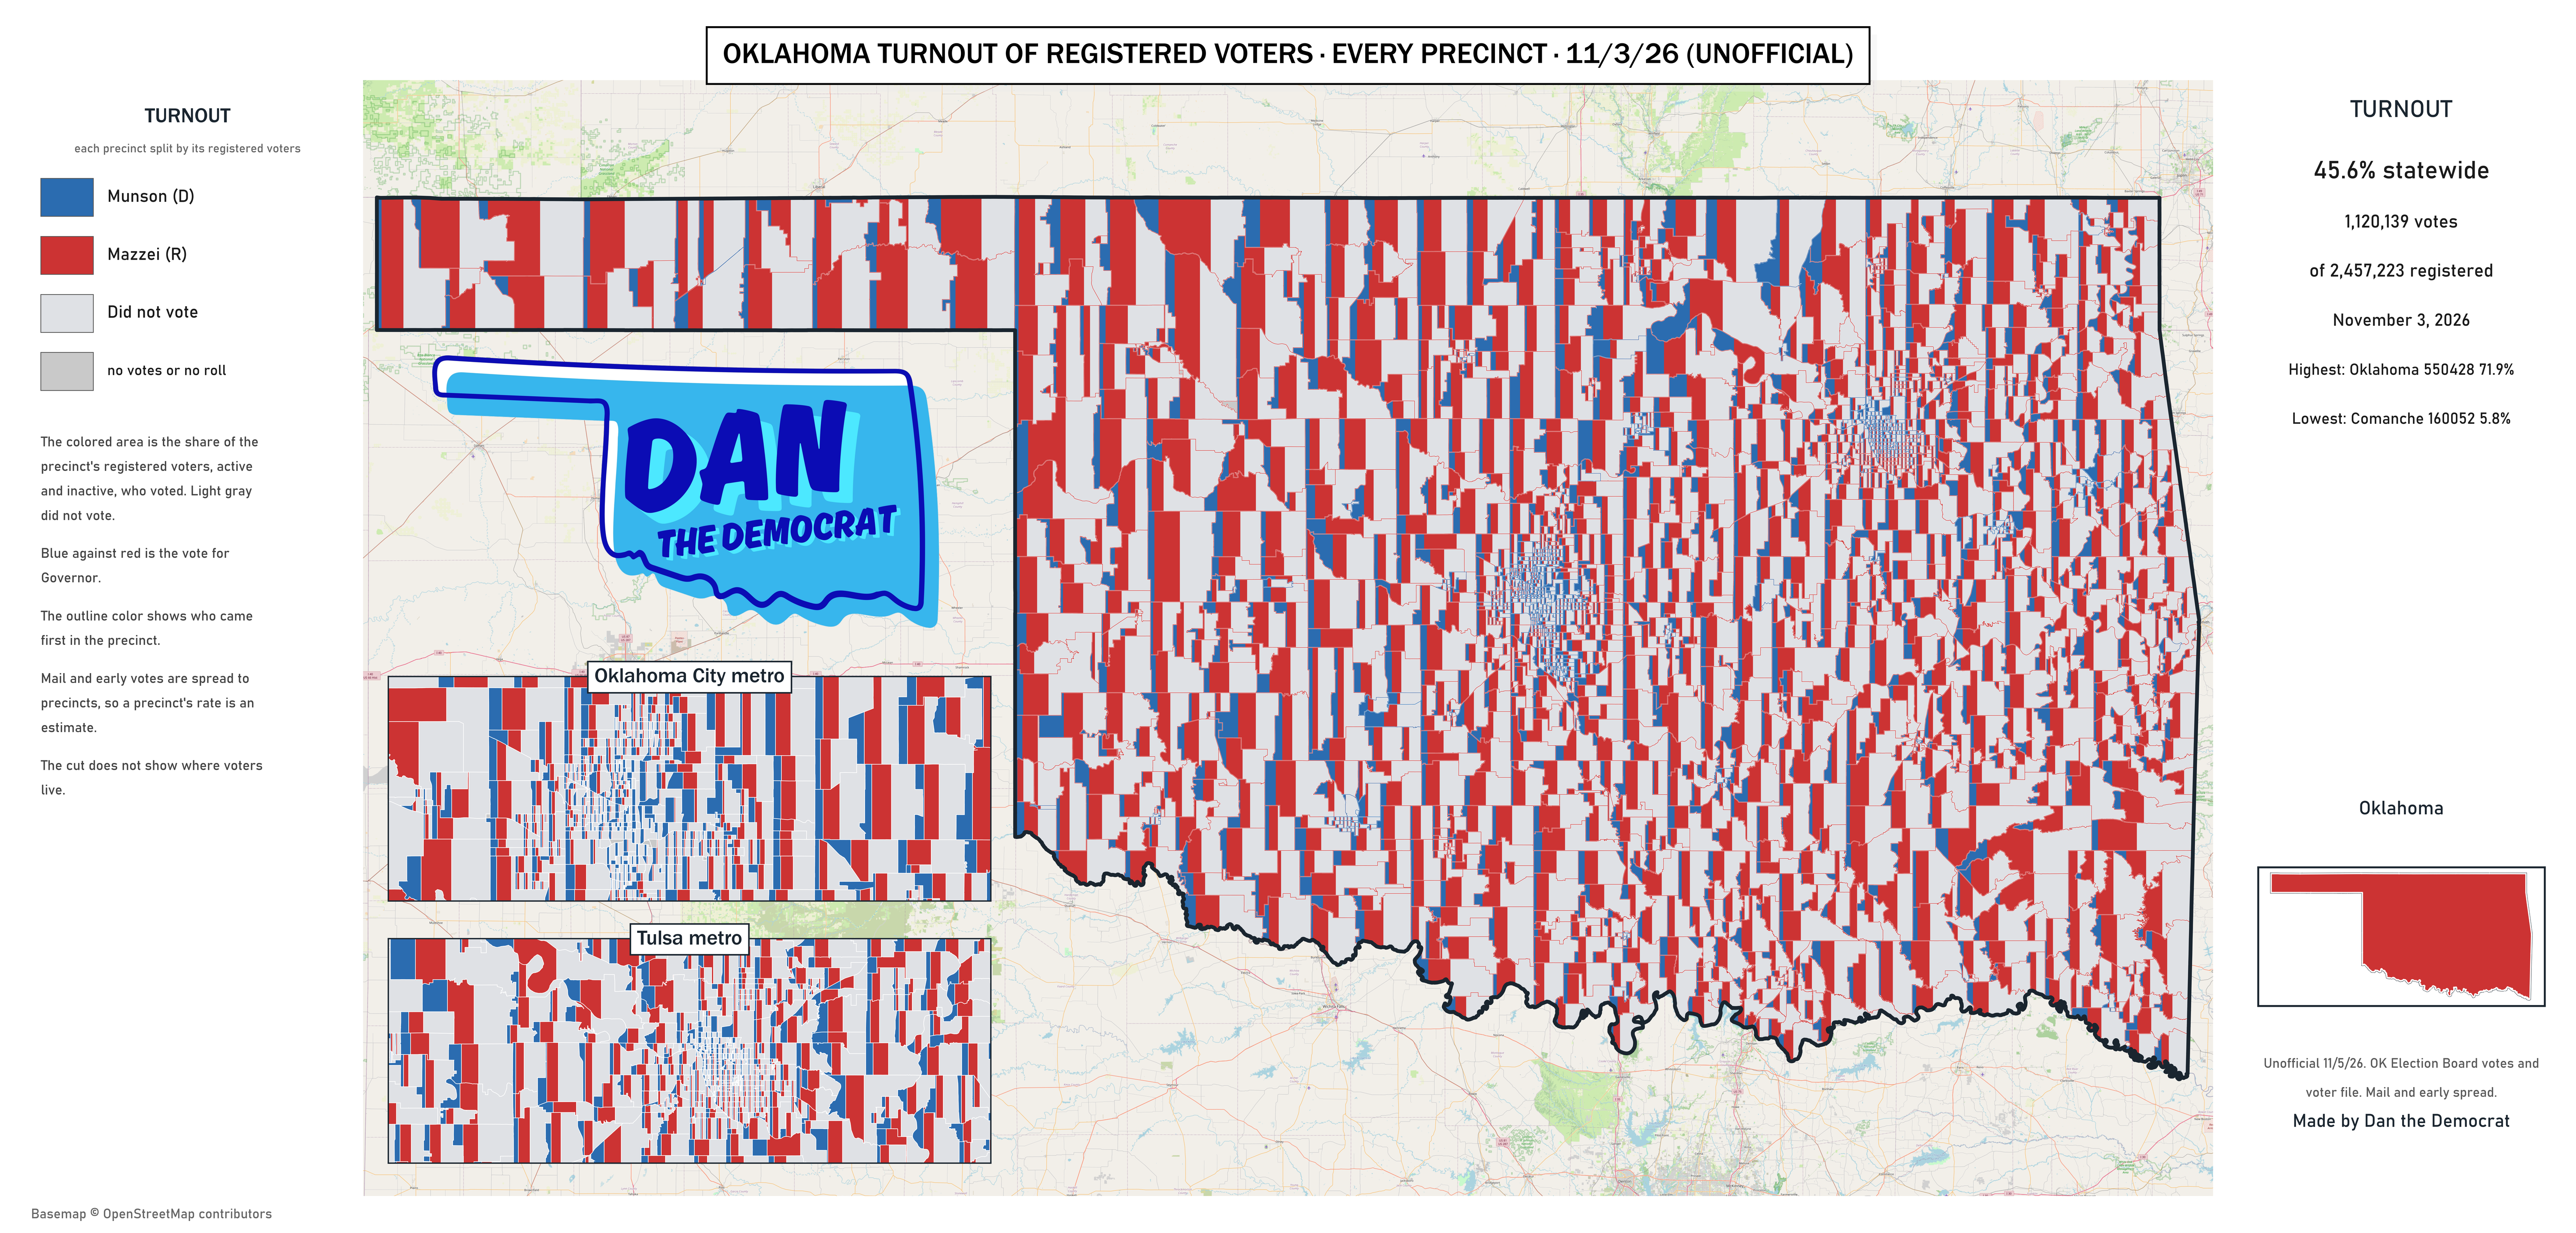
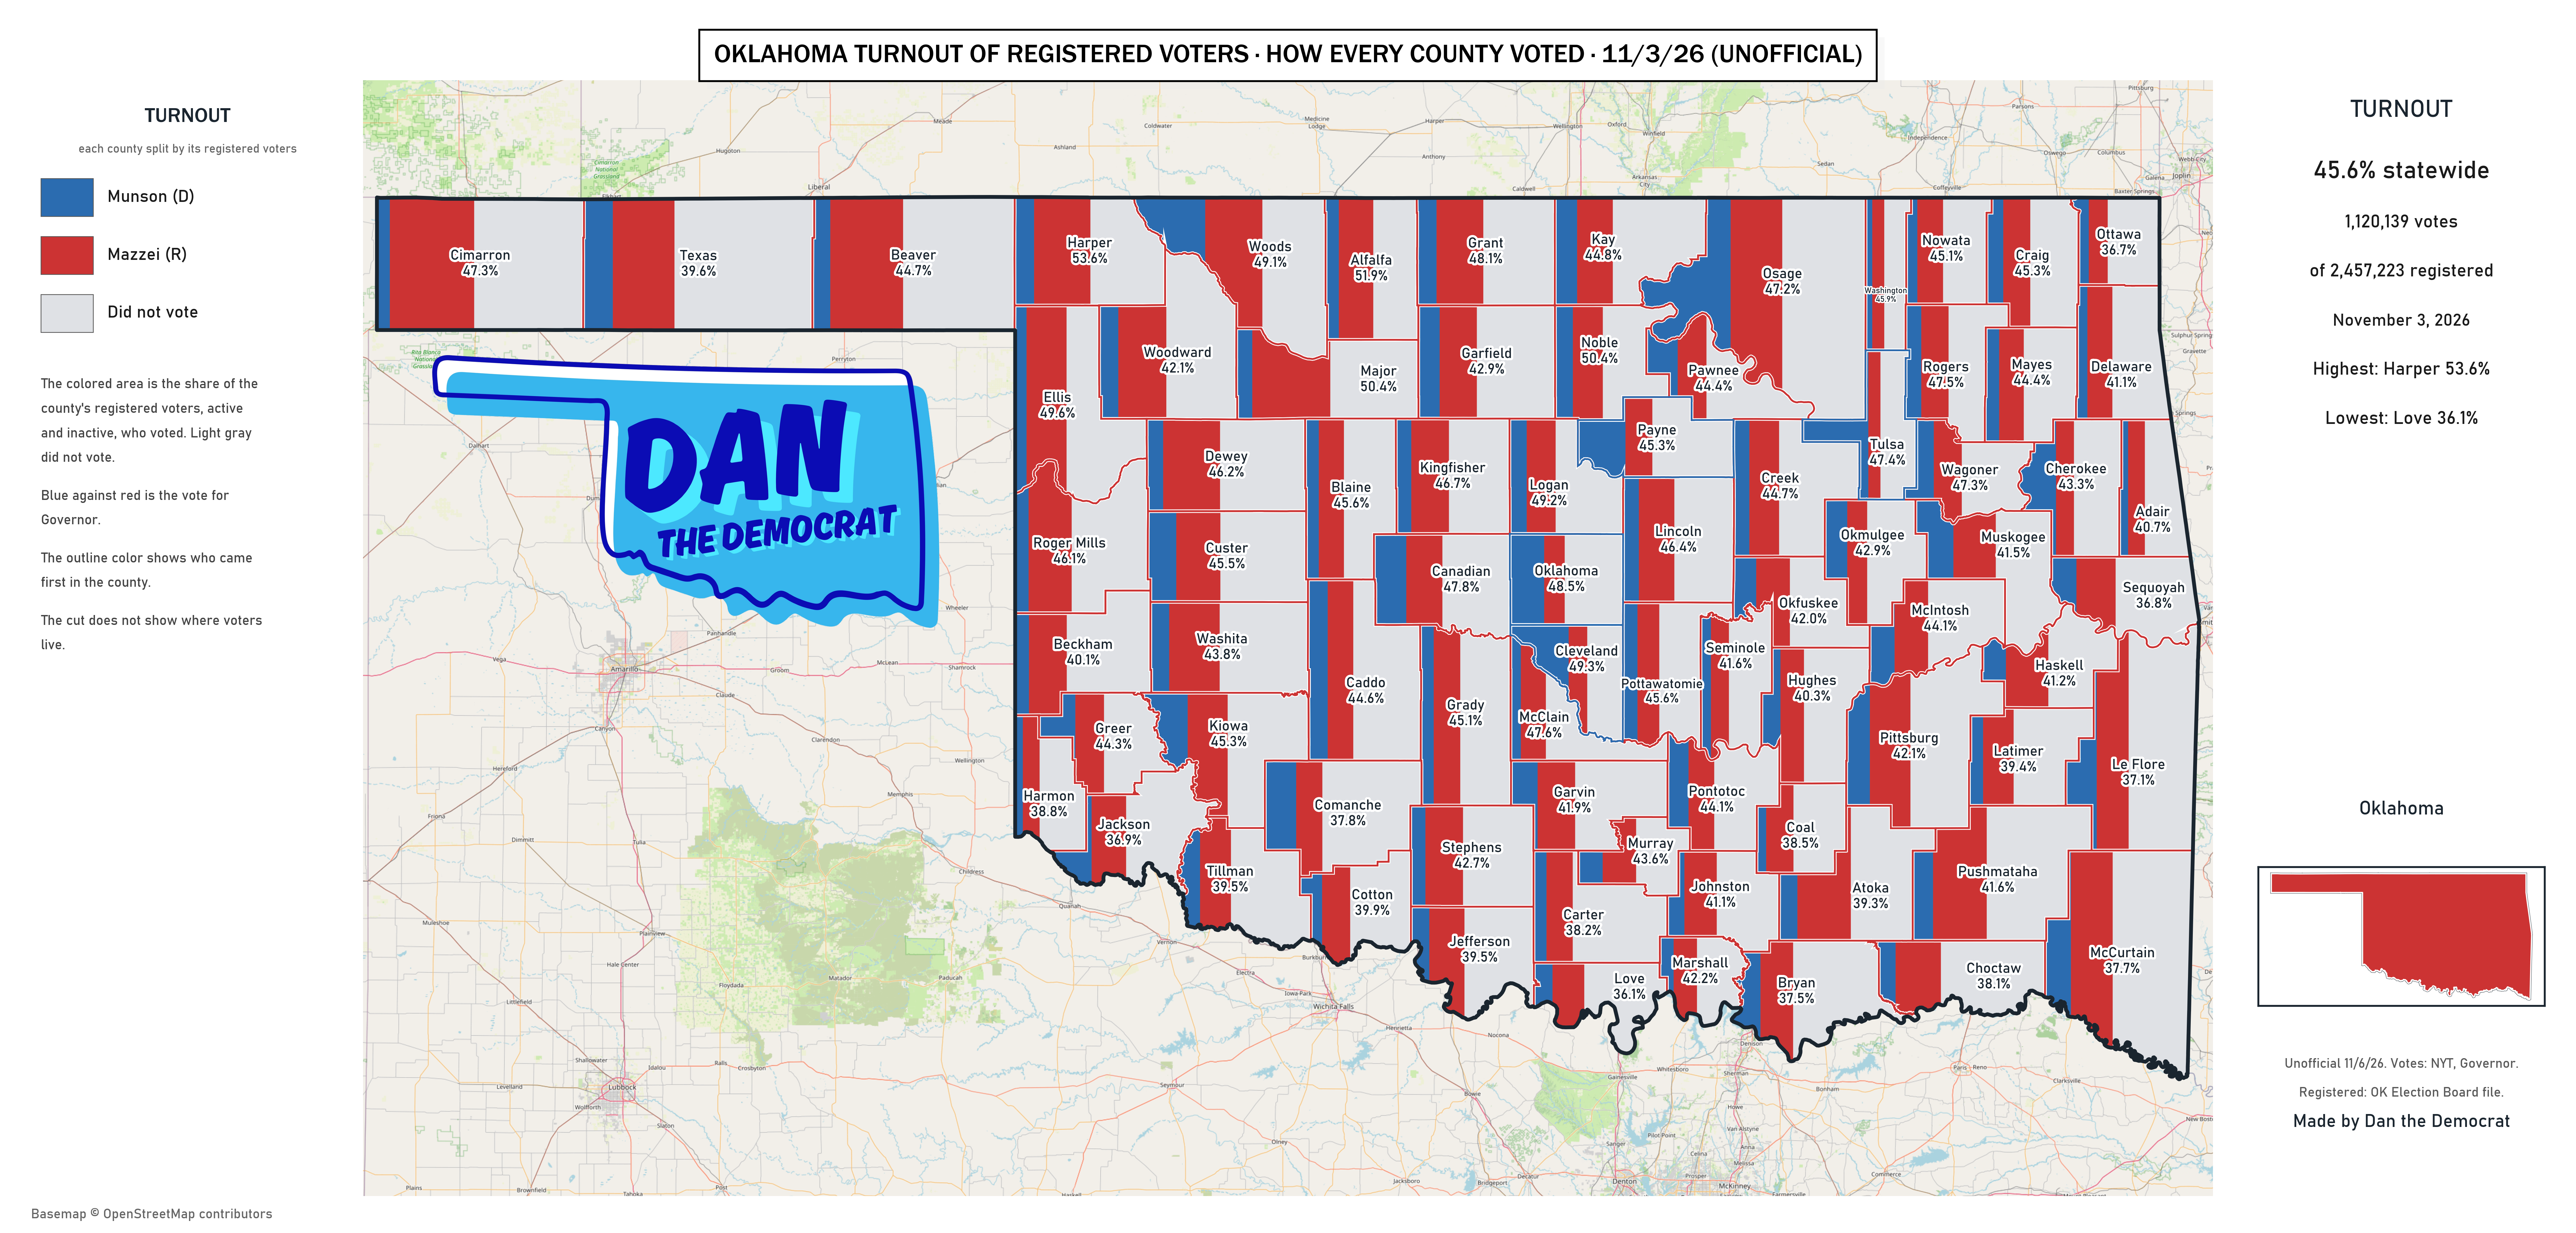
The two turnout stills were drawn on 6 November 2026 from the voter file of that day (2,457,223 registered); the interactive map above uses the Election Board’s count of 31 October 2026 (2,455,735). Both give 45.6%. The figures behind the stills: by precinct (CSV) · by county (CSV).
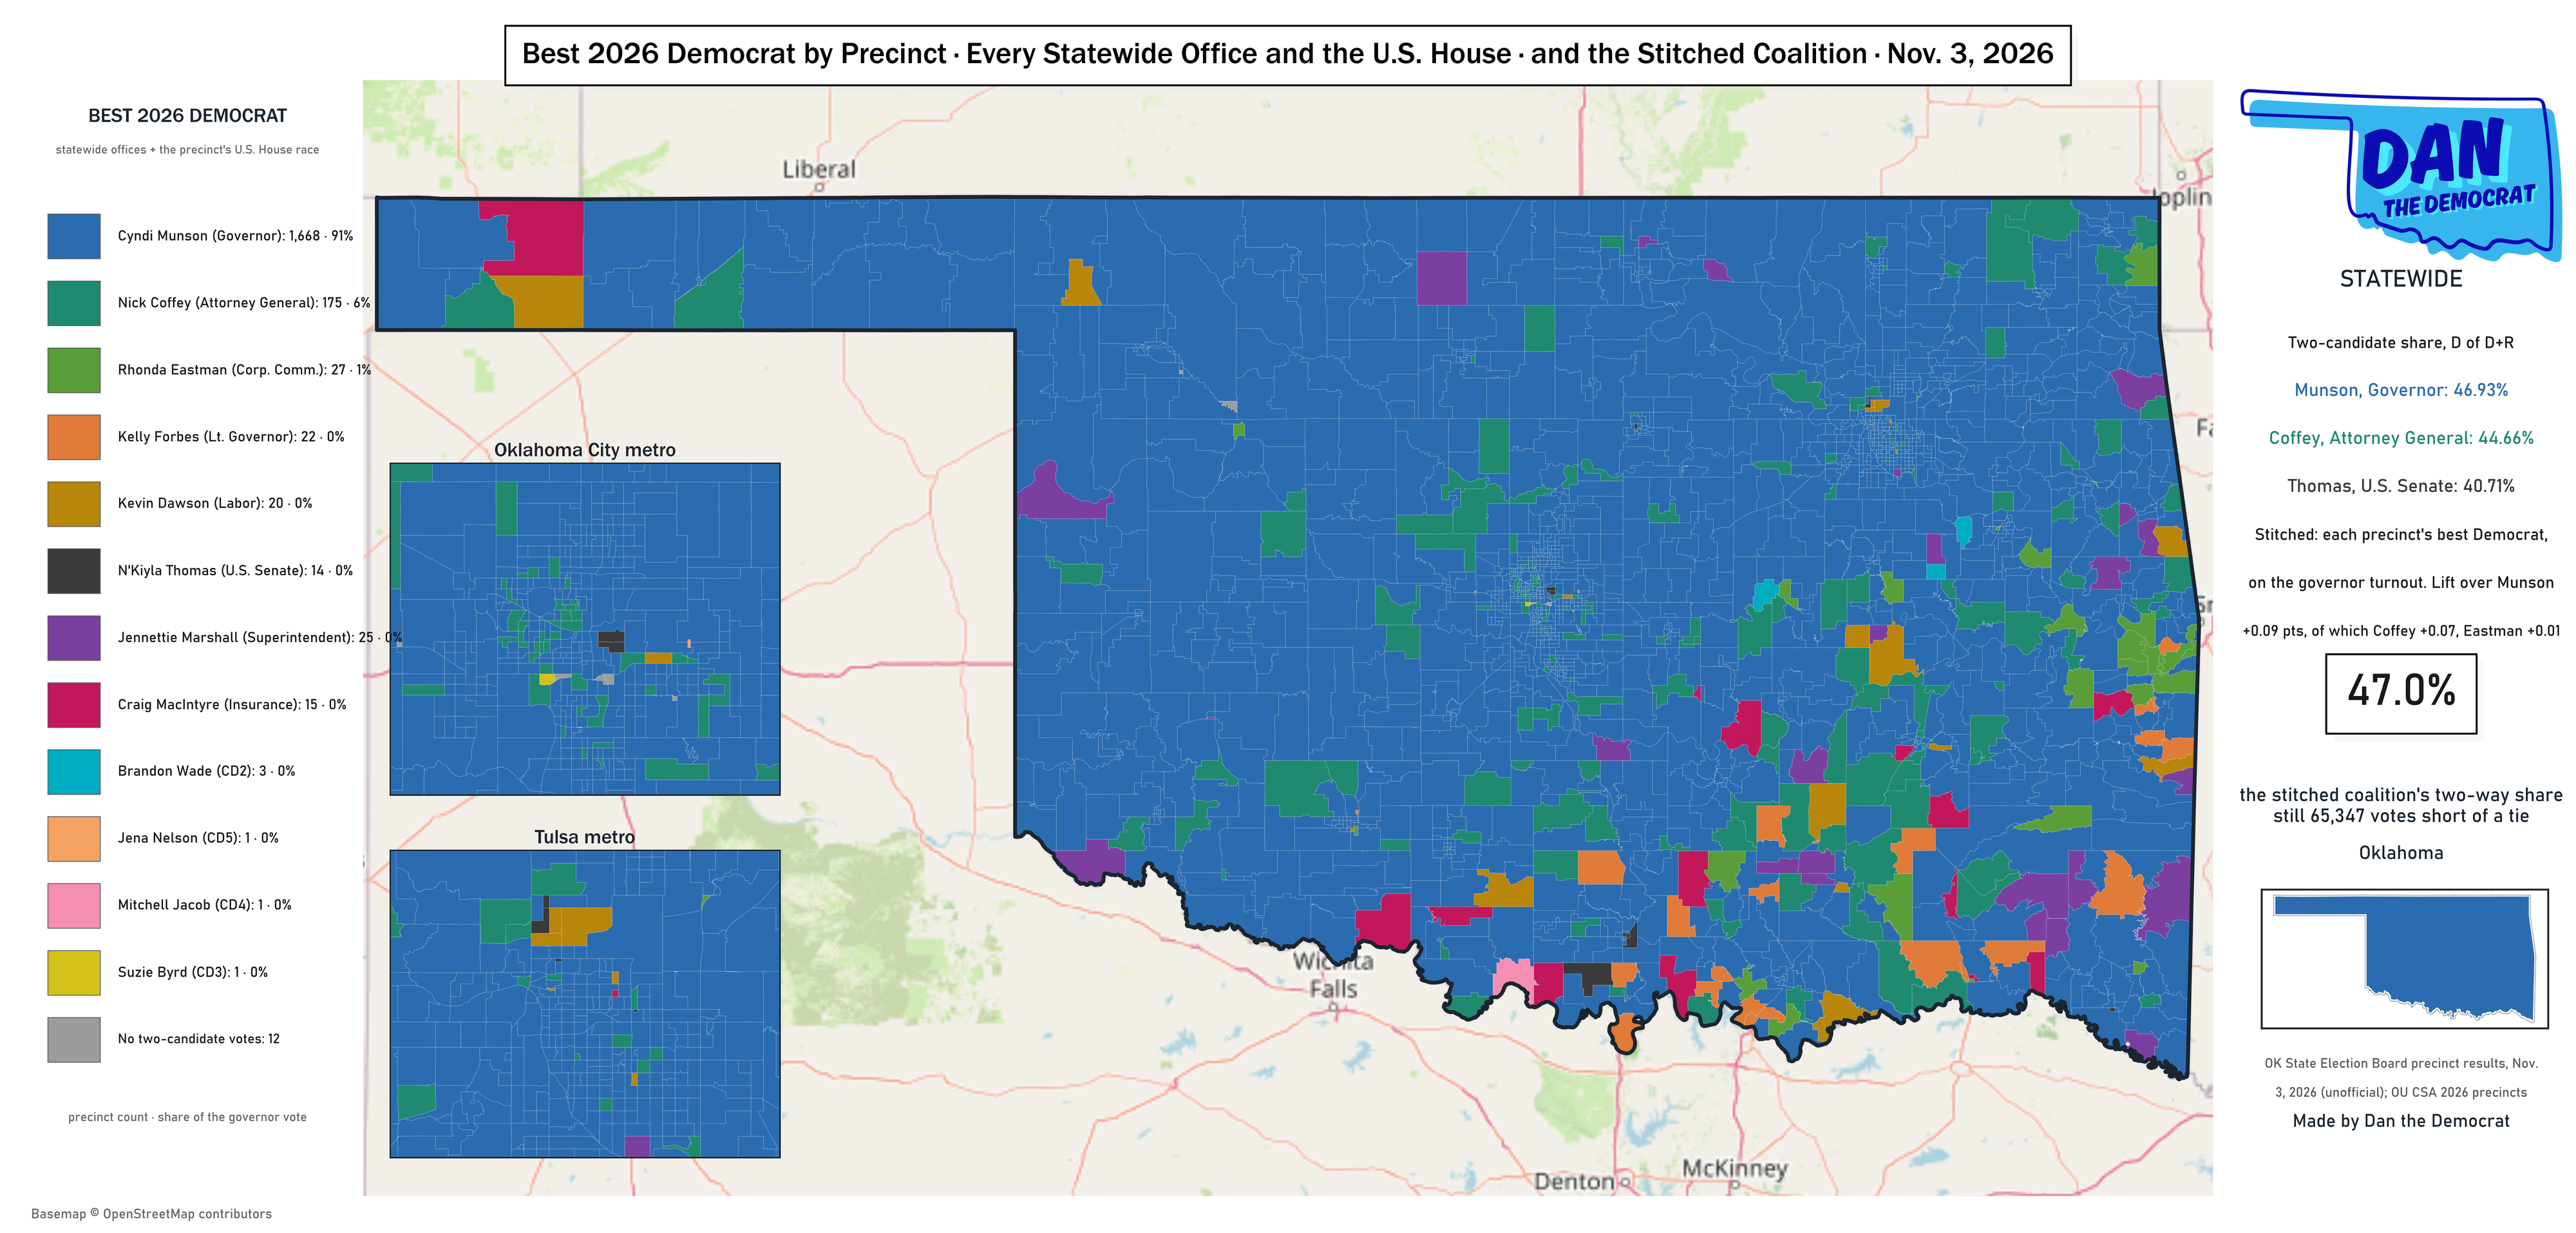
The best Democrat in each precinct
Pool
The still images (PNG, 4,000 pixels wide)
The best Democrat for governor in each precinct: Edmondson 2018, Hofmeister 2022 or Munson 2026
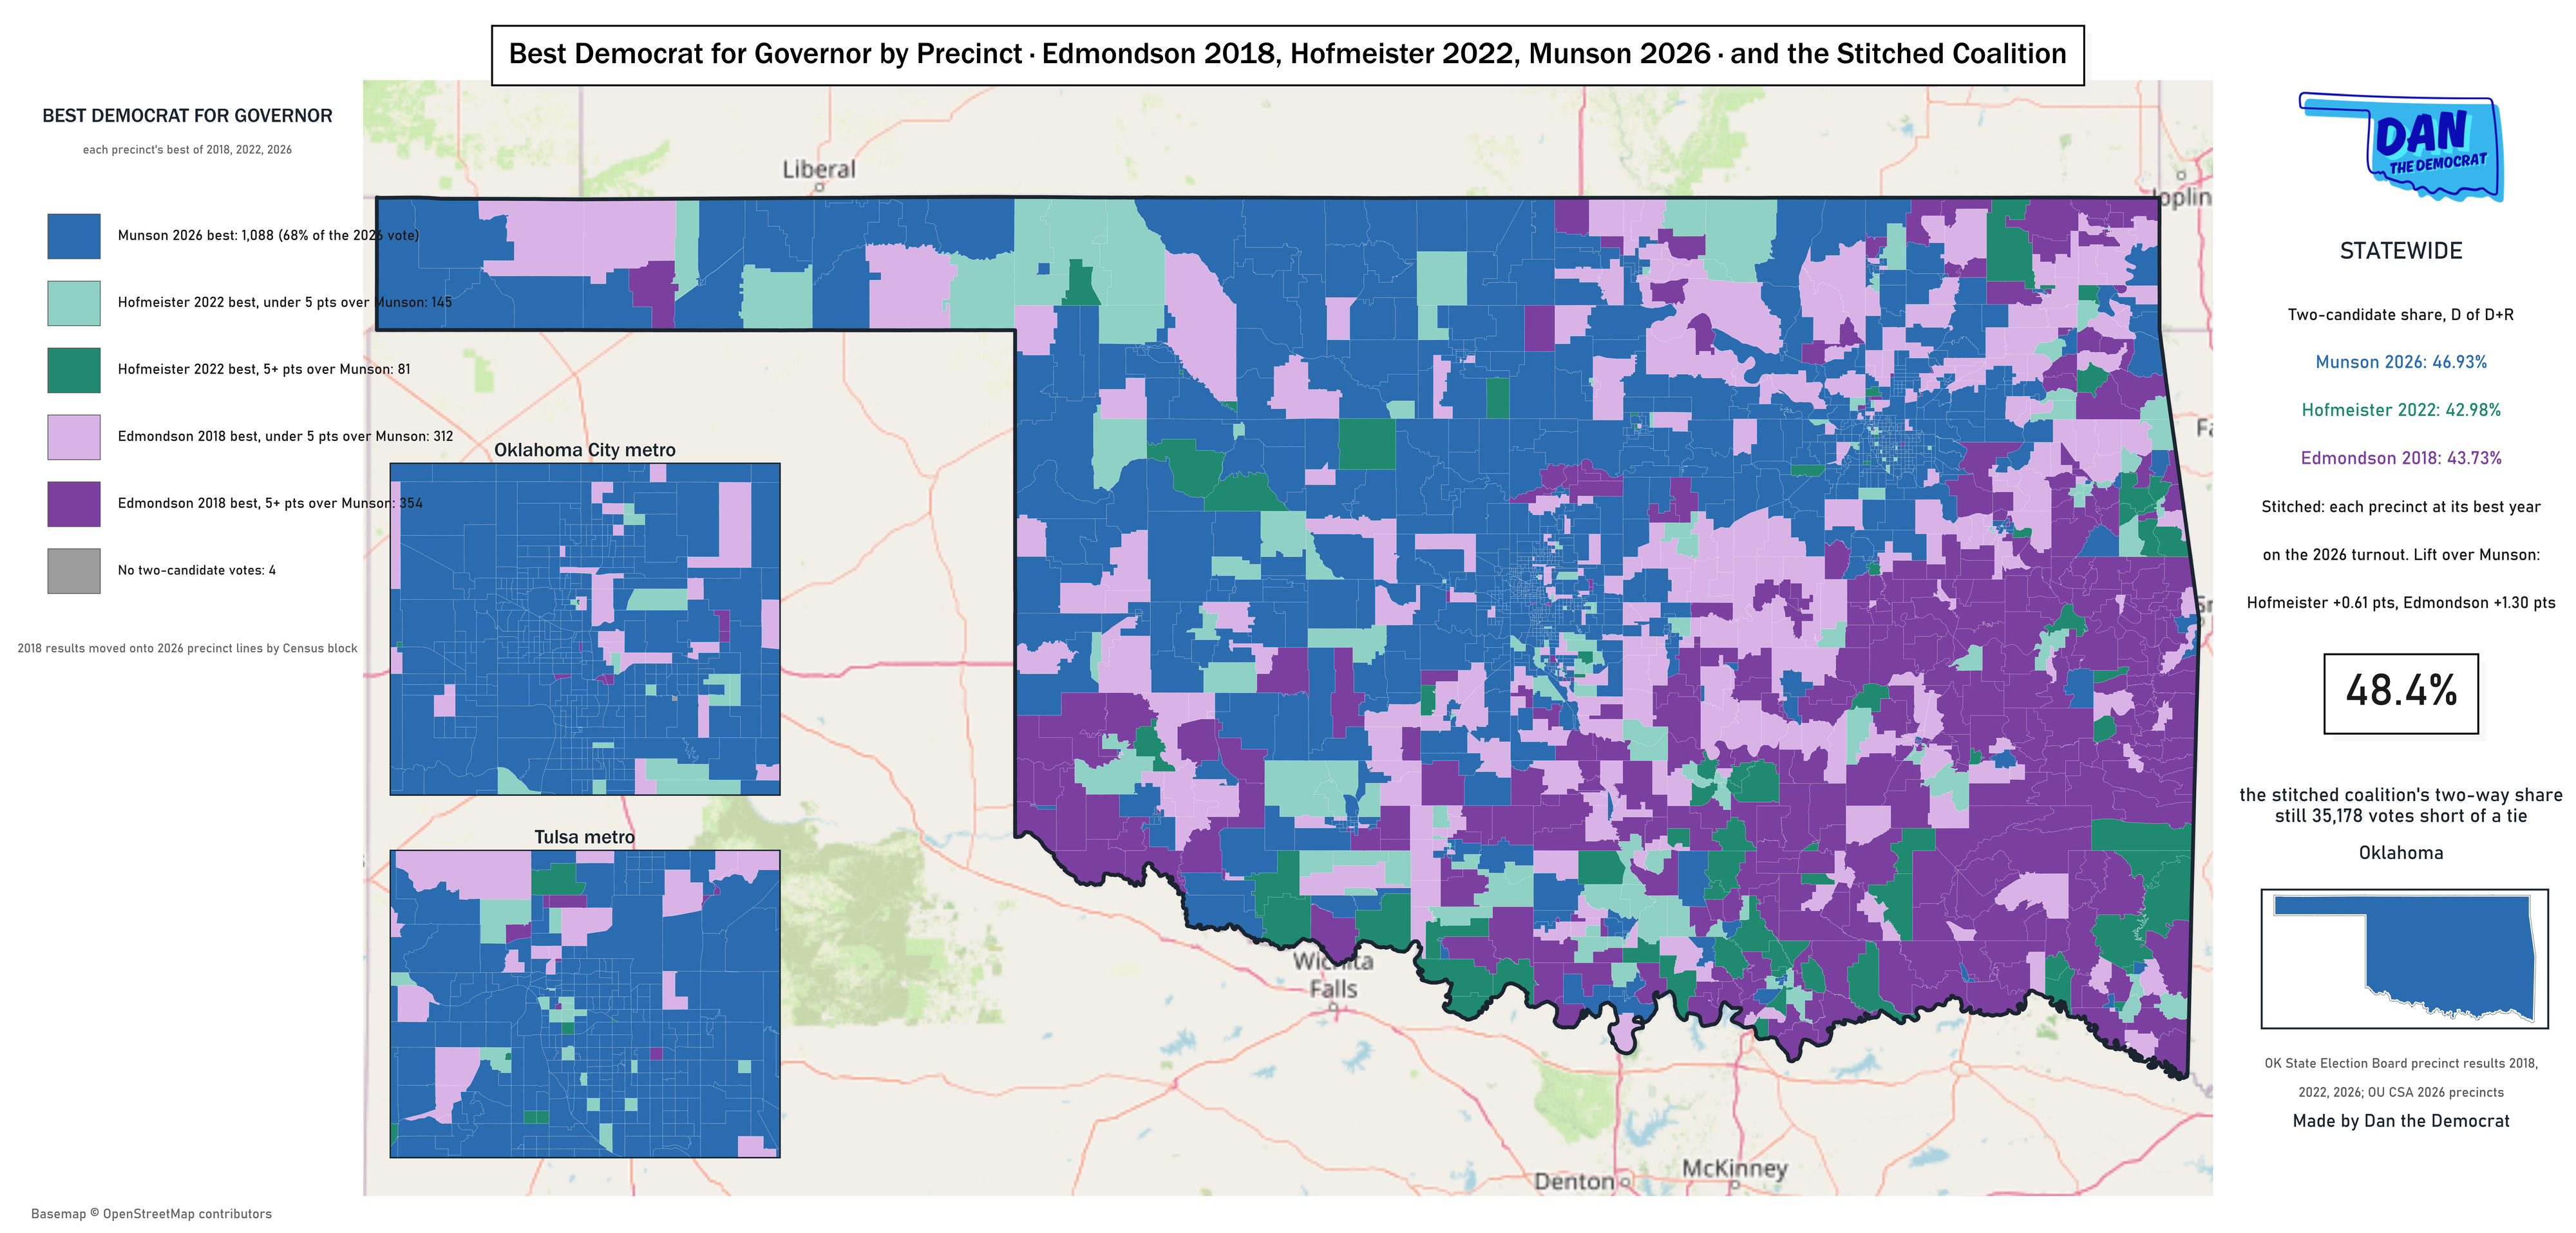
The best 2026 Democrat in each precinct: every statewide office and the U.S. House seat
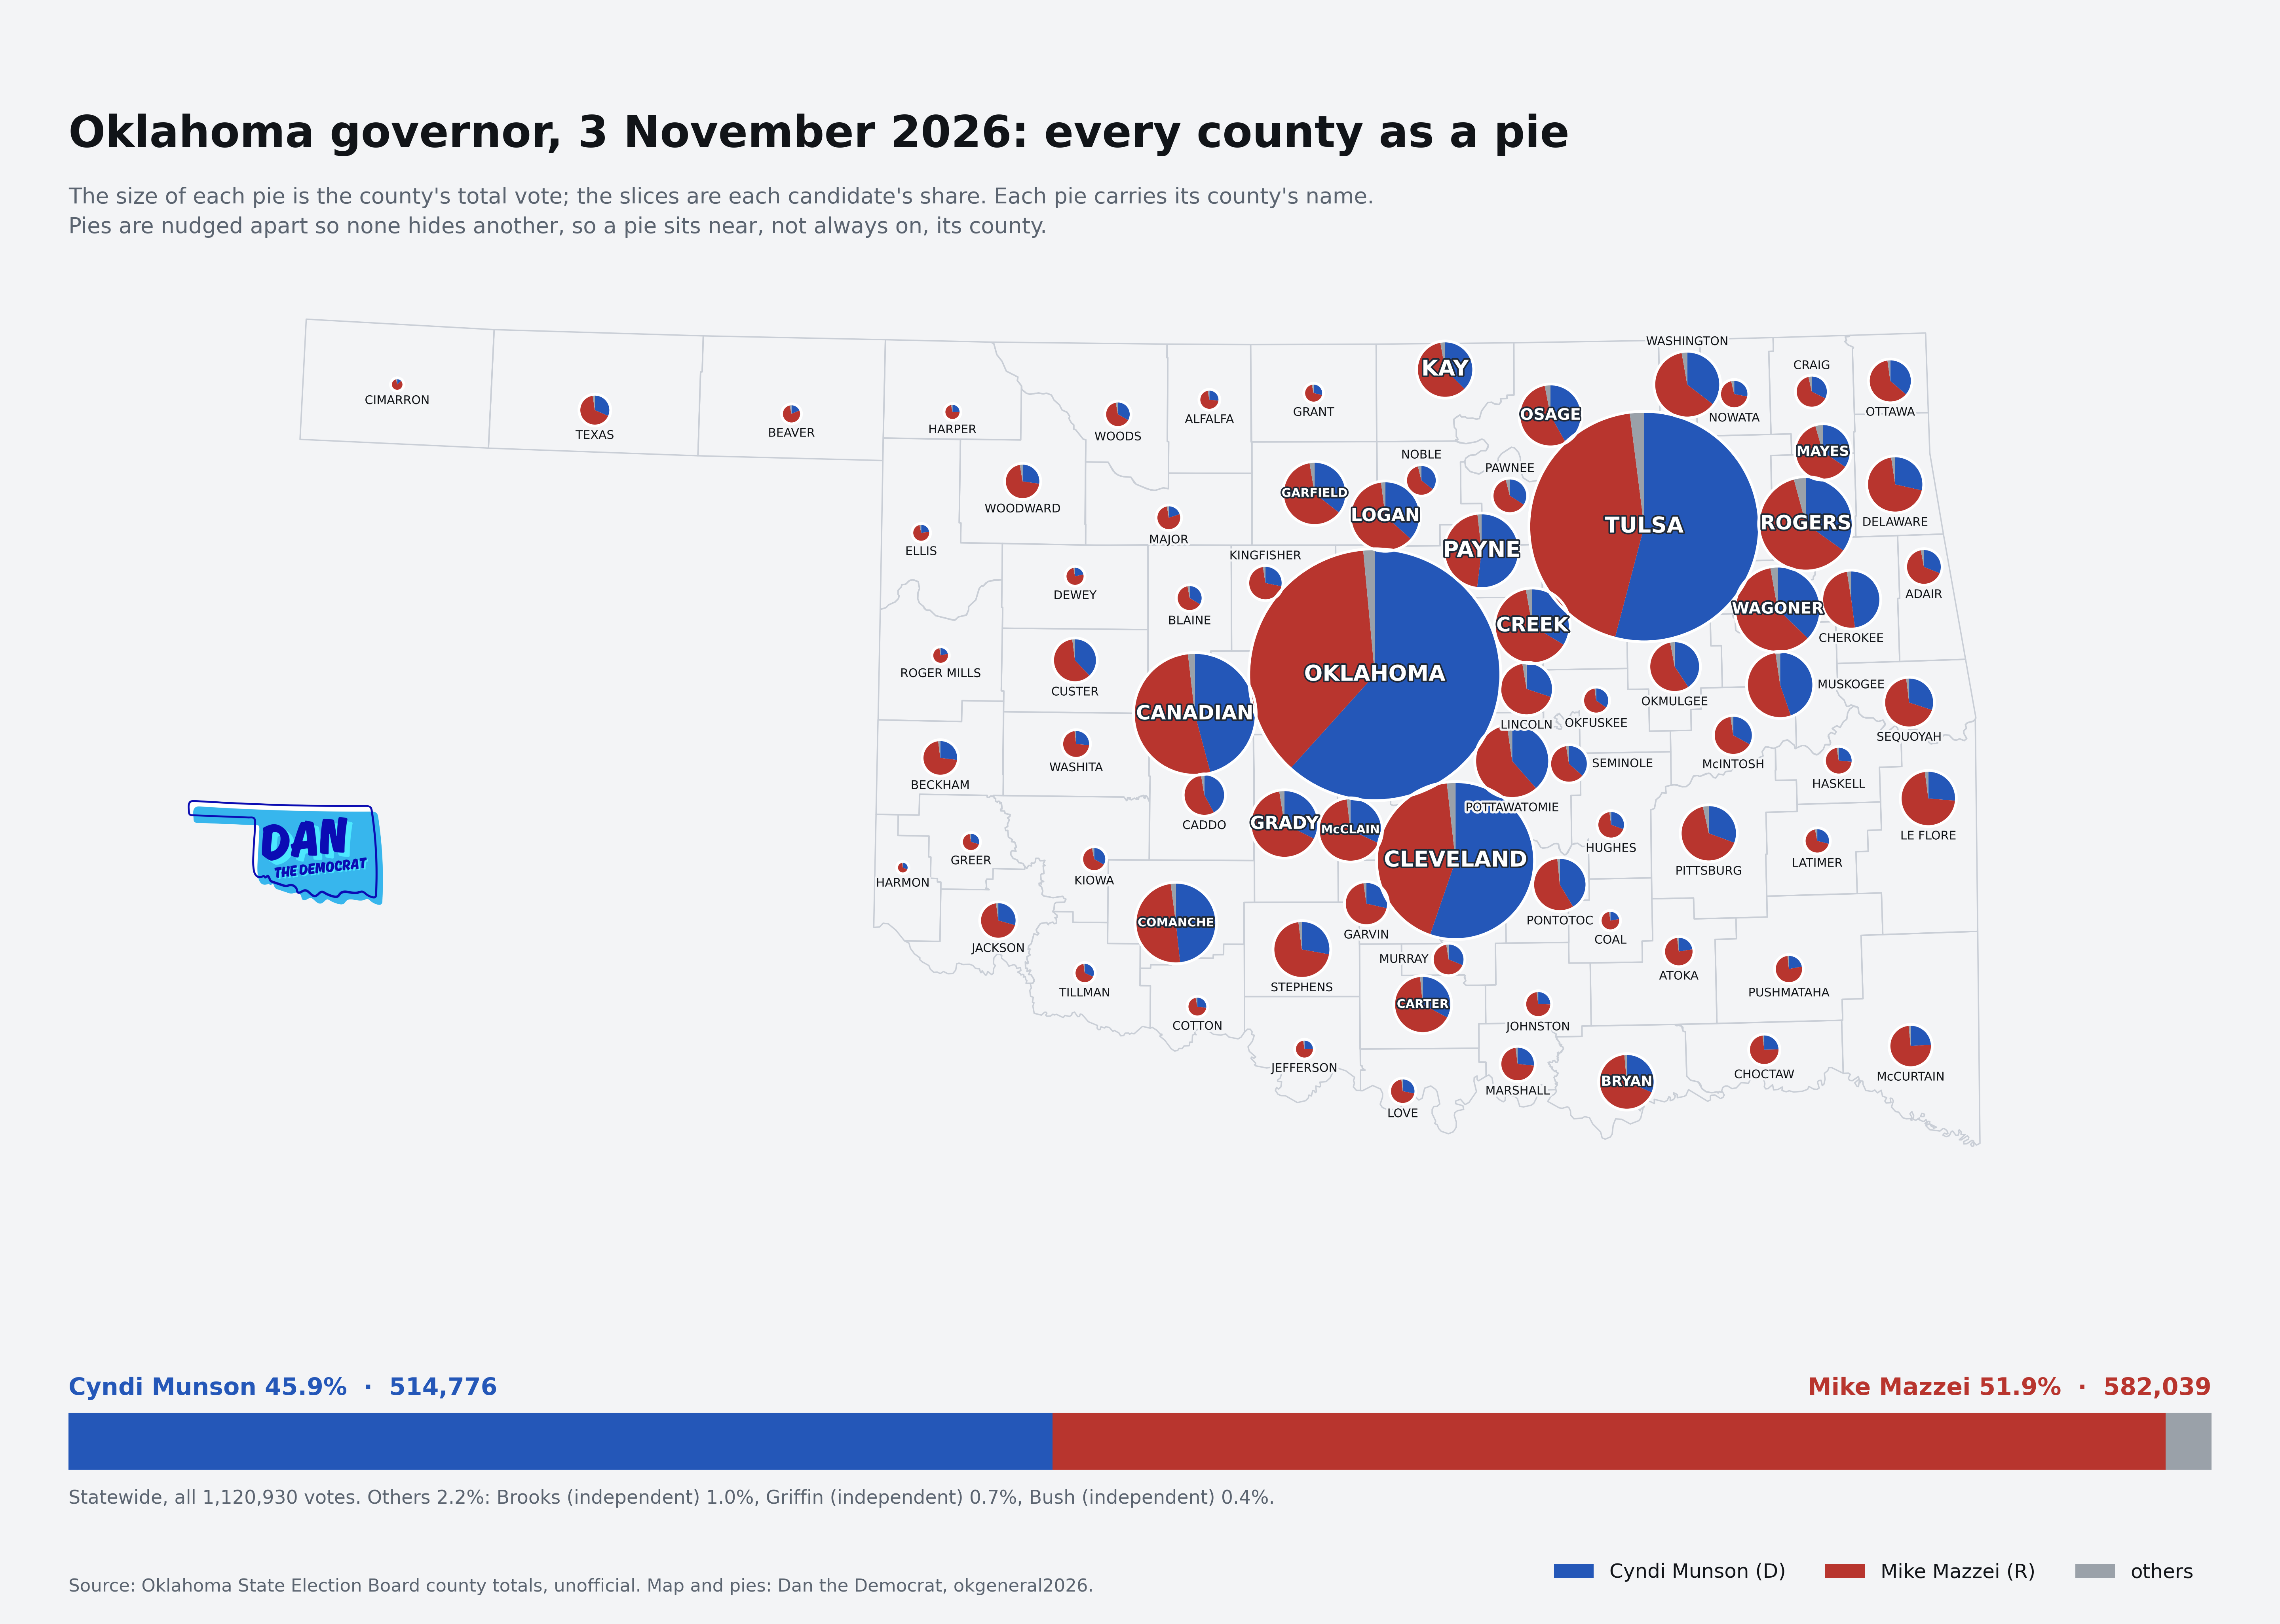
Every county as a pie
Hover or tap a pie for the county’s votes. Scroll to zoom; the pies spread back toward their counties as you zoom in.
The still image (PNG, light and dark)
Turnout by party of registration, county by county
Show
By county
| unit | Democrat 2026 | Republican 2026 | margin 2026 | margin 2022 | swing from 2022 | margin 2018 | swing from 2018 | forecast: Democrat | against the forecast | votes 2026 | votes v 2022 | turnout 2026 |
|---|
Every contested legislative seat, and the U.S. House, against the top of the ticket
| seat | winner | winner's share | Democrat's share | seat margin | governor vote in the seat: Democrat / Republican | the seat against the governor line | governor forecast in the seat: Democrat / Republican | held by | flip? |
|---|
Where Munson carried the seat, and how the Democrat did there
| seat | what happened | Munson’s vote in the seat | seat result | the Republican against the governor line | held by | sitting member on the ballot? | raised: Democrat | raised: Republican |
|---|
Could a stitched coalition win? Every precinct at its best Democratic year
| the vote | Democrat, two-candidate | Democratic votes | Republican votes | short by |
|---|
Drummond’s precincts and Mazzei’s
Cut
| precincts by Drummond’s runoff share | precincts | runoff votes | Drummond | Munson 2026 | Hofmeister 2022 | Edmondson 2018 | swing from 2022 | swing from 2018 | Republican votes v 2022 | Democratic votes v 2022 | college share |
|---|
By region: the swing, the forecast and the coalition
The swing from 2022, region by region
Level
| region | precincts | votes 2026 | Munson 2026 | Hofmeister 2022 | Edmondson 2018 | swing from 2022 | swing from 2018 | Republican votes v 2022 | Democratic votes v 2022 | Drummond’s runoff share | against the forecast | best Democratic year | coalition lift |
|---|
How the ballots were cast
| how the ballot was cast | ballots 2026 (share of all) | ballots 2022 (share of all) | Democrat 2026 | Republican 2026 | Democrat 2022 | Republican 2022 | margin 2026 | margin 2022 | change |
|---|
Where the precinct map was right and where it was off
| forecast band: Democrat's share of all votes | precincts | votes | average miss | direction |
|---|
Who voted, by party of registration
| party of registration | voted 2026 | share 2026 | voted 2022, same counties | share 2022 | voted 2018, same counties | share 2018 | 2026 against 2022 |
|---|
How each party’s voters cast their ballot, 2026
| how the ballot was cast | ballots | share of all | Democrats | Republicans | independents | Libertarians |
|---|
The counties that have posted
| county | credits | of the ballot floor | complete? | Democrats 2026 | Democrats 2022 | Republicans 2026 | Republicans 2022 | independents 2026 | independents 2022 | Democratic share 2026 | Democratic share 2022 |
|---|
Turnout, and where the swing came from
By how the precinct voted in 2022
| Democrat’s share of all votes, 2022 | precincts | share of 2026 ballots | ballots v 2022 | ballots v 2018 | Democrat 2026 | Republican 2026 | margin 2026 | swing from 2022 | swing from 2018 |
|---|
By the makeup of the precinct
| precincts | precincts | share of 2026 ballots | ballots v 2022 | ballots v 2018 | Democrat 2026 | Republican 2026 | margin 2026 | swing from 2022 | swing from 2018 |
|---|
Two lenses at once
| row | column | precincts | ballots v 2022 | ballots v 2018 | Democrat 2026 | Republican 2026 | margin 2026 | swing from 2022 | swing from 2018 |
|---|
The lenses together: what holds when the rest are held constant
| measure of the precinct | per | swing from 2022, the rest held constant | swing, this lens alone | ballots v 2022, the rest held constant | ballots, this lens alone |
|---|
What the next model changes
What this page is
Independent analysis by Dan Williams · danthedemocrat.com · 2026 General Election HQ. This is not a campaign website.